The zero-dollar data stack with dlt, DuckDB, dbt and anfra
TL;DR. You can go from a public API to a live, shareable dashboard for $0 a month with five open-source tools: dlt (ingestion), DuckDB (storage), dbt Core (transformation), GitHub Actions (orchestration) and anfra (semantic layer and BI). In this post I build one end to end on GitHub activity data for the data tools themselves. It took a little over two hours from an empty repo to a published dashboard, and the only paid tool was my coding agent.
Code: lelouvincx/zero-dollar-data-stack.
Dashboard: zero-dollar-data-stack.pages.holistics.dev.
1. Introduction
Are you a data engineer or analytics engineer who wants:
- a portfolio project that covers ingestion to dashboard
- a free stack for a side project, a small team or a startup
- to see what “BI as code” looks like in practice
Then this post is for you.
By the end of this post, you will:
- build a daily pipeline from the GitHub API to DuckDB with dlt and dbt
- schedule it for free with GitHub Actions
- define metrics once in a semantic layer, and have a coding agent build a dashboard on them
- share the dashboard with a link
Background
I remember three years ago when I was a college student, the modern data stack was assembled in my project Goodreads ELT pipeline. It was a microservice-inspired project which ran 11 docker containers on my laptop: MySQL, Postgres, MinIO, Spark, Dagster, Metabase. It worked. It also ate up 4GB of RAM, 6 CPU and a free afternoon to start on my old ASUS laptop.

Three years later, the open-source data stack is much lighter. DuckDB replaces my Postgres and MinIO. dbt runs on DuckDB. GitHub Actions replaces Dagster. Every layer now has a free default I can just run for free.
Every layer except one: BI.
Your choices for BI are still roughly these:
- pay per seat for a hosted BI tool
- self-host a drag-and-drop tool, then redefine your metrics inside every chart
- ask an AI to build a dashboard on raw tables, and hope it calculates revenue the same way twice
So I tried to close that gap with anfra, an open-source framework for building BI apps, anfra has a generous free plan - enough for my need.
2. Objective
In this project, I use GitHub activity data for the tools in this stack, plus a few of their peers. Yes, the stack analyses itself 😄
Repos tracked:
| Layer | Repos |
|---|---|
| Ingestion | dlt-hub/dlt |
| Storage | duckdb/duckdb |
| Transformation | dbt-labs/dbt, SQLMesh/sqlmesh |
| Semantic layer and BI | holistics/anfra, cube-js/cube, evidence-dev/evidence, metabase/metabase, apache/superset |
If you want to add any, submit a PR!
Main question: which open-source data tools are the healthiest to adopt?
Stars are a popularity contest, so I look at signals you would check before you bet a project on a tool:
- how fast maintainers first respond to a new issue
- how often the project ships a release
- how much of the work comes from outside the core team
- whether activity is growing or slowing over time
3. Design
3.1 The stack
| Layer | Tool | Cost | Free limit |
|---|---|---|---|
| Ingestion | dlt | $0 | open source |
| Storage | DuckDB (local), MotherDuck (shared) | $0 | DuckDB: open source. MotherDuck Lite plan: 10 GB storage, 10 hours of compute a month, up to 3 users, no credit card |
| Transformation | dbt Core + dbt-duckdb | $0 | open source |
| Orchestration | GitHub Actions | $0 | standard GitHub-hosted runners are free with no minute cap in public repos (private repos on GitHub Free get $12 of compute a month, about 2,000 Linux minutes) |
| Semantic layer and BI | anfra | $0 | open source CLI |
| Sharing | anfra Cloud | $0 | free during the beta |
| Builder | Claude Code, Codex or another coding agent | $20/month (Claude subscription) |
If you use it properly, this stack costs basically $0. The only thing I pay for is the coding agent I use for development.
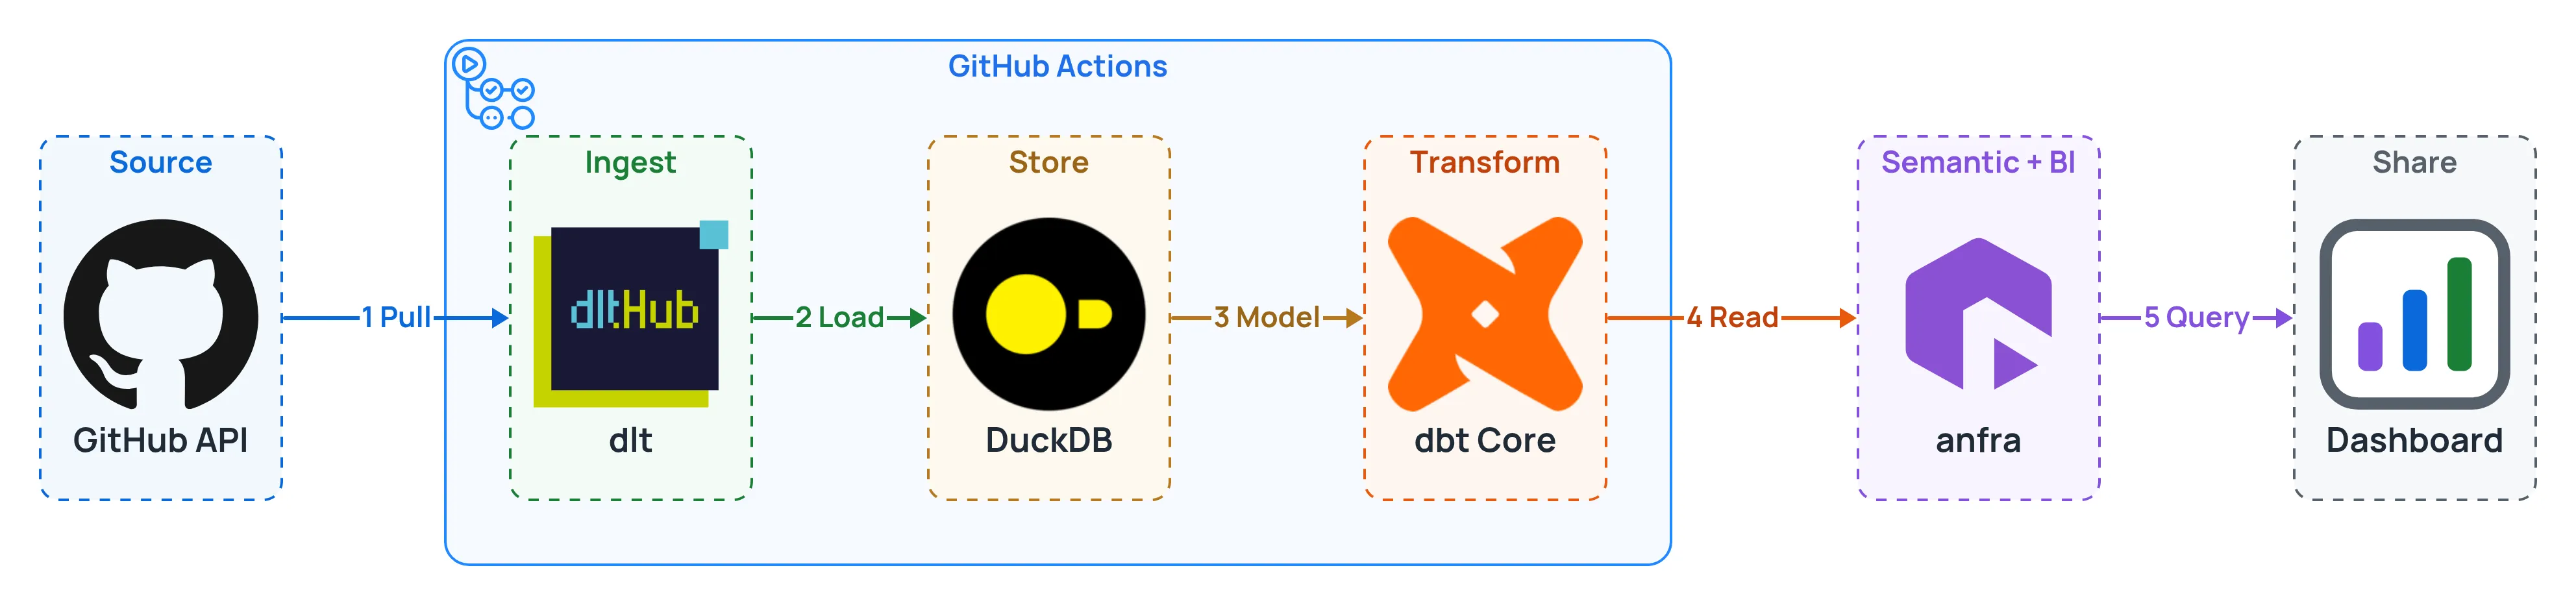
Every day at 01:00 UTC, GitHub Actions runs steps 1 to 3:
- Pull:
dltpulls new and updated issues, pull requests and releases from the GitHub API. - Load:
dltloads them into DuckDB. - Model:
dbtcleans them into staging models, then builds the marts:dim_repos,dim_authors,fct_issues,fct_pull_requests,fct_releasesandfct_repo_snapshots. - Read marts:
anfrareads the marts through AML models and a dataset, where every metric is defined once. - Query: the dashboard asks anfra for metrics by name. It never writes its own SQL.
3.2 Directory tree
zero-dollar-data-stack/
├── ingest/                    # dlt pipeline: repos, issues, pull requests and releases from the GitHub API
├── transform/                 # dbt project: staging and marts on DuckDB
├── anfra/                     # the anfra project
│   ├── .anfra/
│   │   ├── data_sources.yml     # the warehouse connection
│   │   └── context_sources.yml  # points anfra at the dbt project
│   ├── models/                # semantic layer, in AML
│   ├── datasets/              # semantic layer, in AML
│   └── apps/                  # the dashboard, one HTML file
├── .github/
│   └── workflows/
│       ├── refresh.yml        # daily ingest and transform
│       └── validate.yml       # runs `anfra validate` on every pull request
├── Makefile                   # shortcuts
└── AGENTS.md                  # agent's instruction for development and maintenance
3.3 Data model
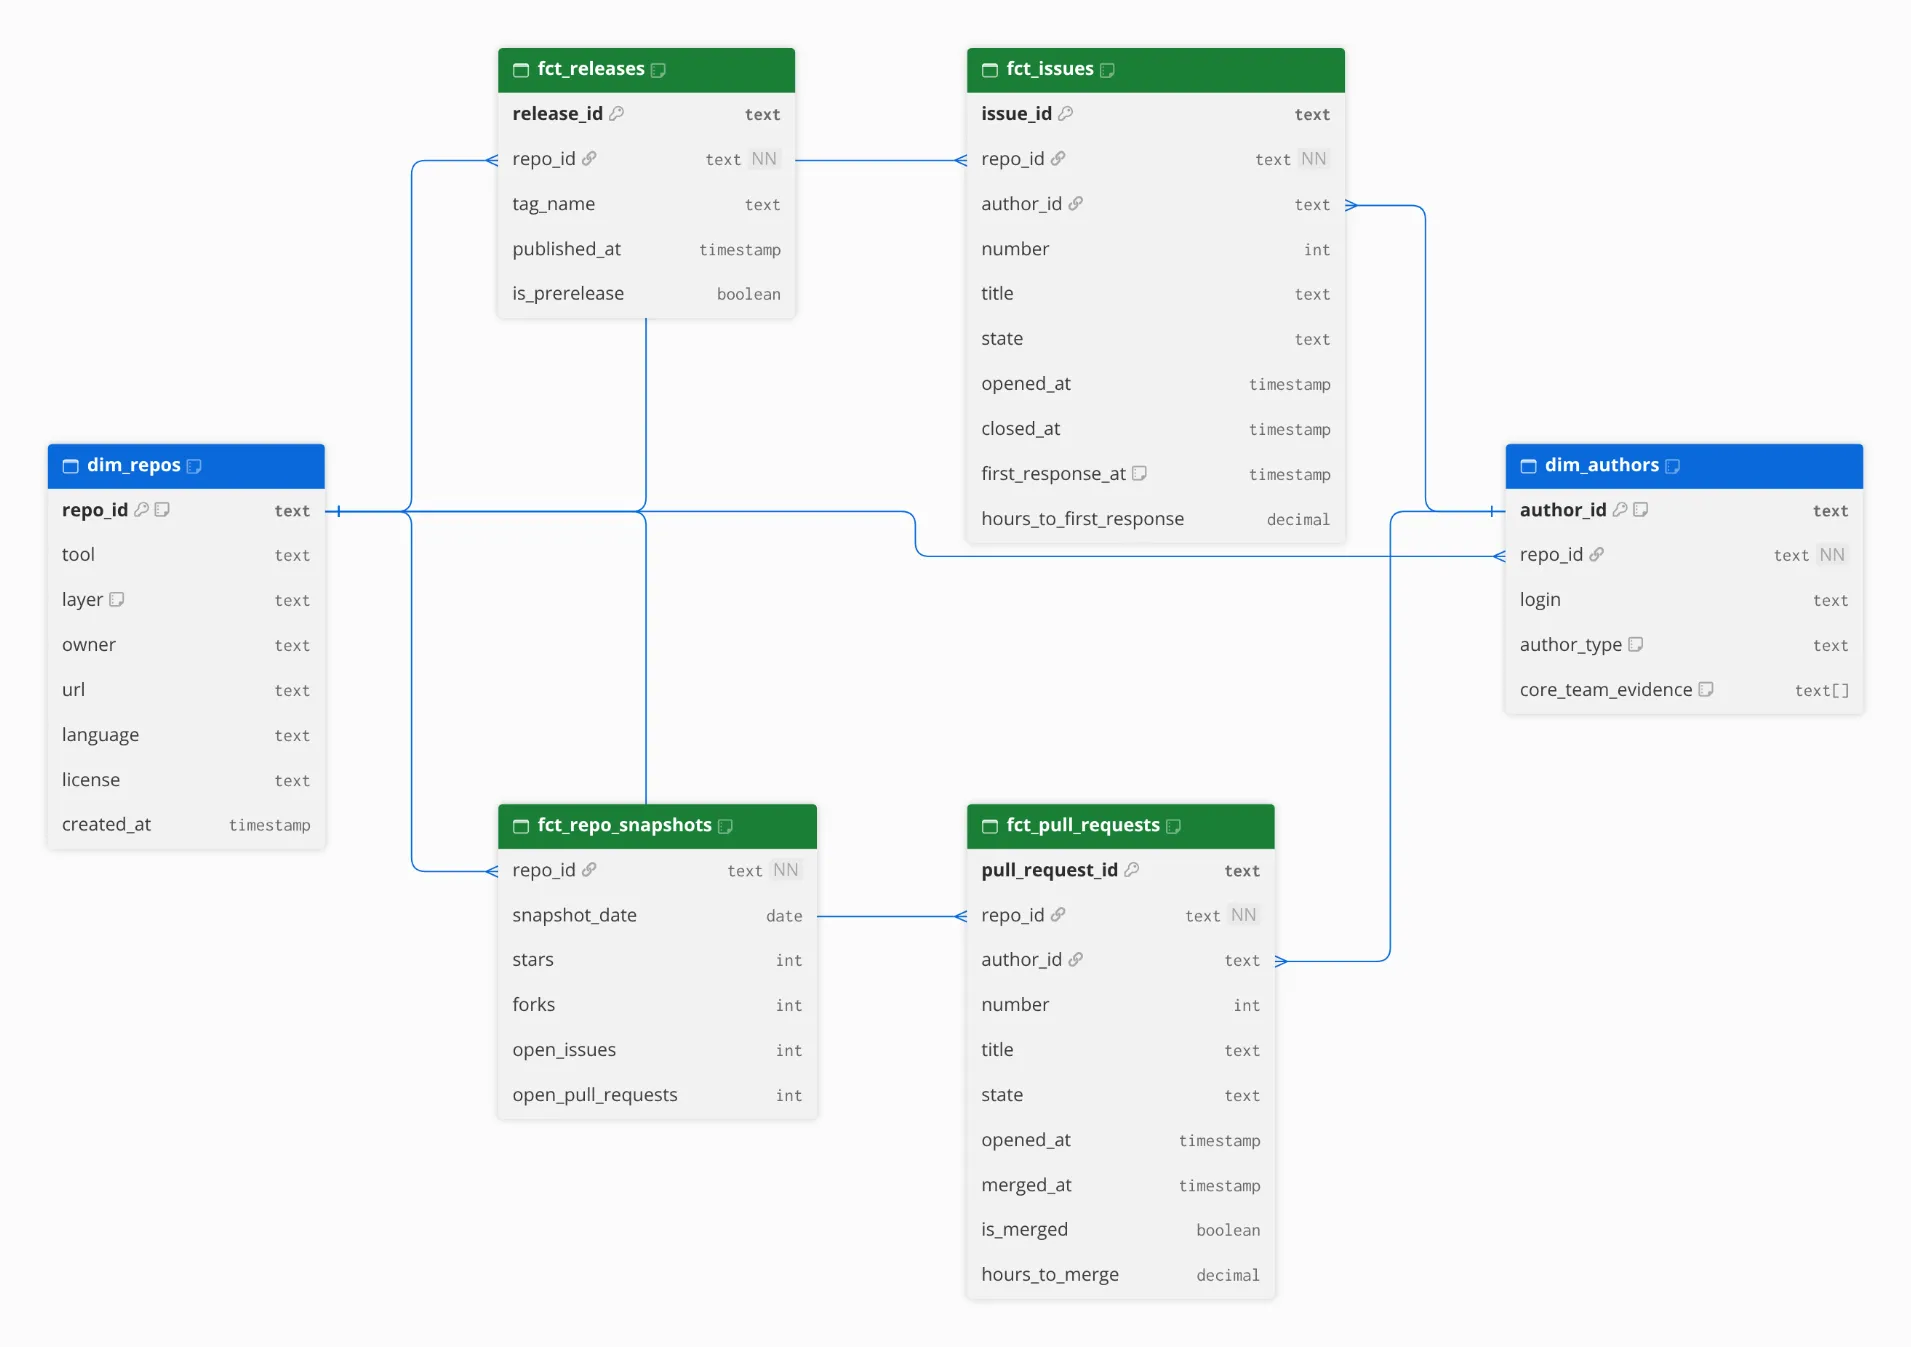
dim_repos: one row per repo, with its tool name, layer, owner, language and licensedim_authors: one row per person per repo, with their author type: core team, community or bot. The type belongs to the pair, because the same login can be core team in one repo and community in another.fct_issues: one row per issue, with opened time and first maintainer response timefct_pull_requests: one row per pull request, with merge timefct_releases: one row per release, with tag and publish timefct_repo_snapshots: one row per repo per day, with stars, forks and open work. Star counts change daily, so they live here, not indim_repos.
4. Setup
4.1 Prerequisites
- A GitHub token with public read access, for the API rate limit
- A coding agent: Claude Code, Codex, Amp or similar
4.2 Clone and install
git clone https://github.com/lelouvincx/zero-dollar-data-stack.git
cd zero-dollar-data-stack
make install   # uv sync: dlt, dbt-duckdb and their dependencies
4.3 Install anfra
anfra comes in two parts, the CLI and the skills that teach your coding agent to use it:
curl -fsSL https://anfra.ai/install.sh | bash
anfra agent setup   # installs the skills for Claude Code and Codex
For other agents, such as Amp, install the skills with npx skills add holistics/anfra-skills -a <agent-id> -g -y.
5. Detailed code walkthrough
5.1 Ingest with dlt
I use GitHub’s GraphQL API rather than REST, because one query returns an issue with its author, its author’s role and its first 10 comments. dlt does the rest:
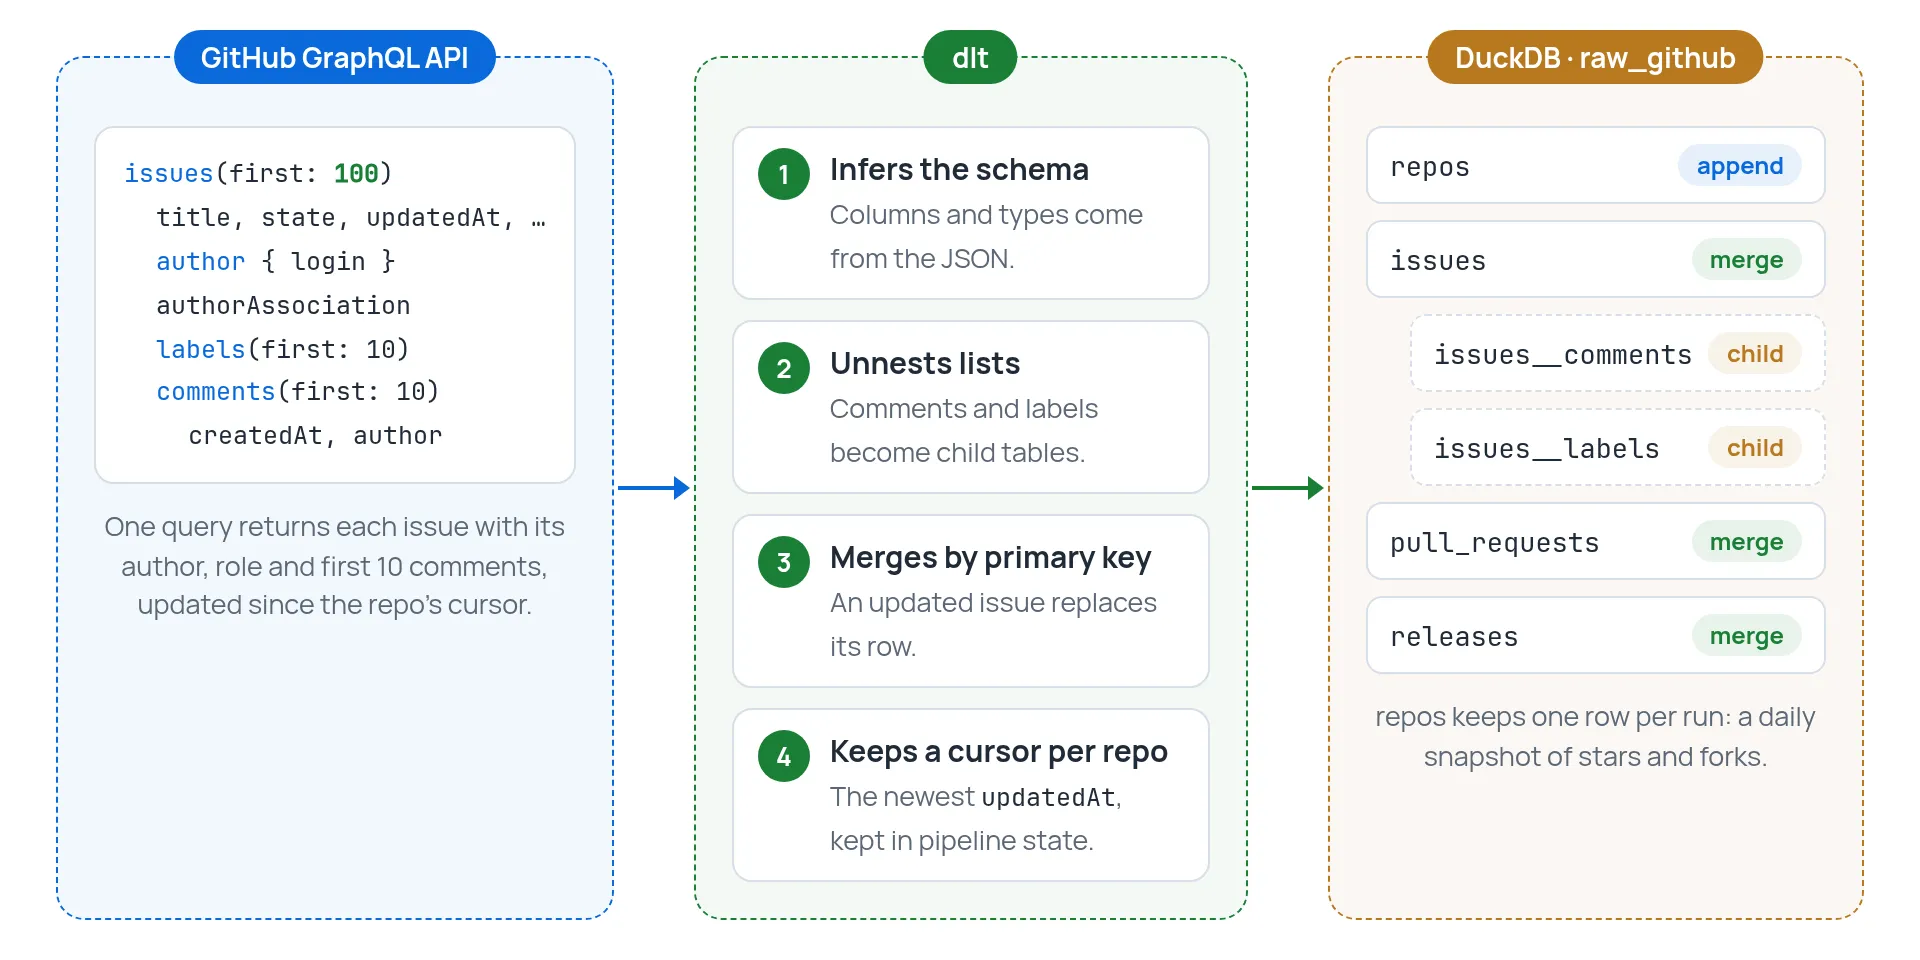
The full pipeline is one file, ingest/github_pipeline.py. To track another tool, add it to REPOS and submit a PR.
The first load covers 365 days for nine repos: about 15,000 issues, 34,000 comments, 47,500 pull requests and 586 releases, in about 26 minutes. A daily incremental load takes about half a minute on GitHub Actions.
5.2 Transform with dbt
I won’t teach dbt here. If you’re new to it, Start Data Engineering’s dbt tutorial is a great start. The project has three layers: staging models clean each raw table, and marts join them into the facts and dimensions the dashboard reads.
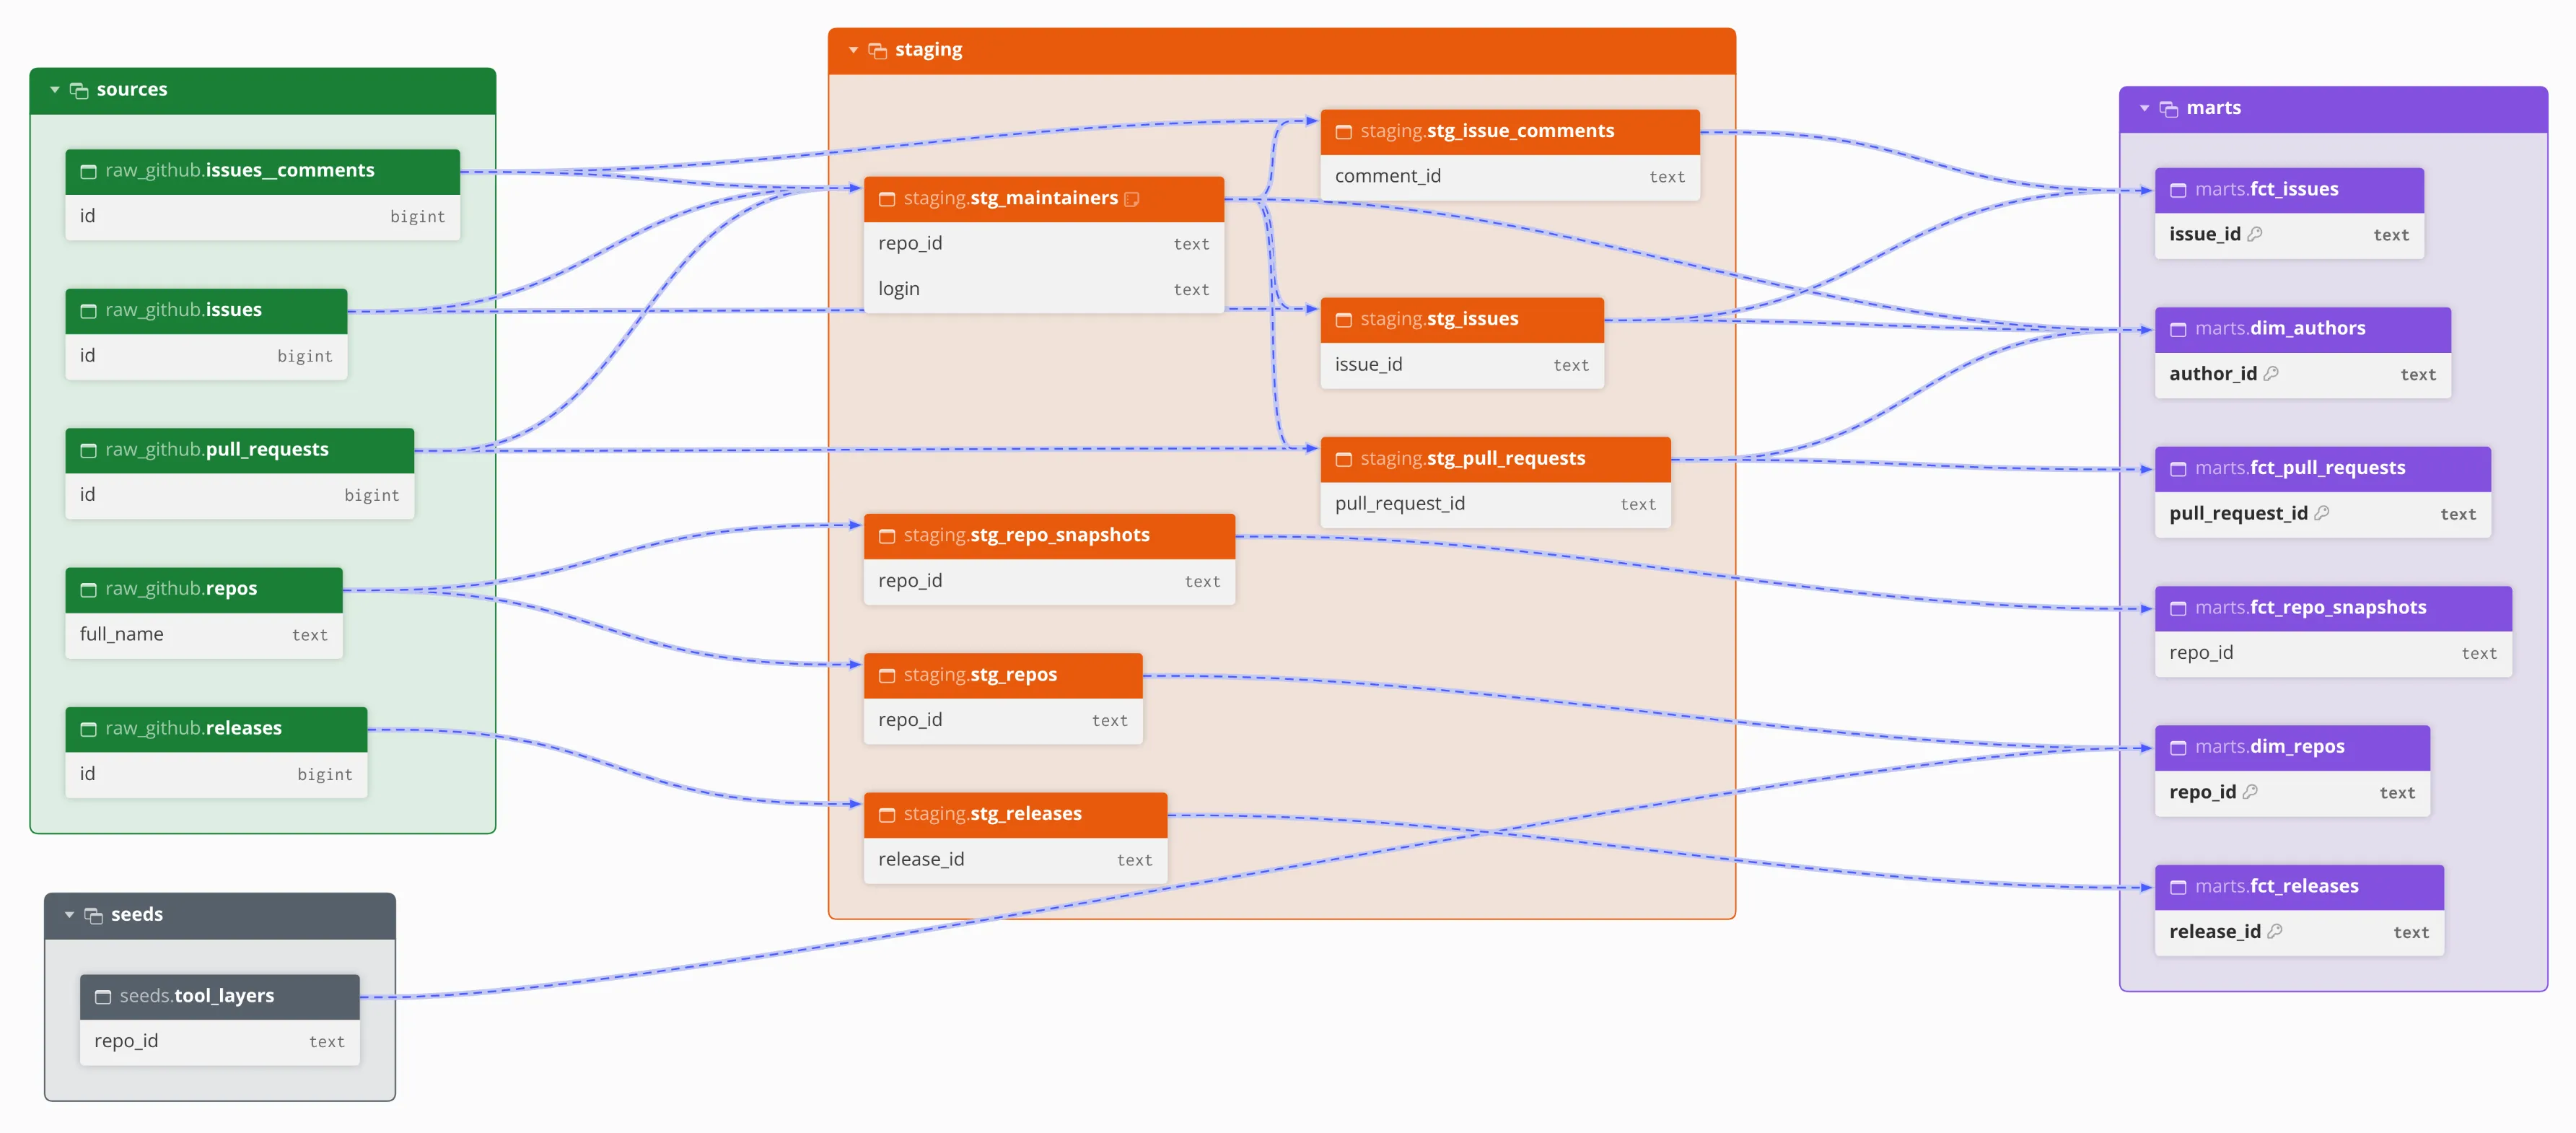
stg_maintainers is the model to read closely. It decides who counts as core team, and every “first maintainer response” depends on it. The models are in transform/models.
5.3 Schedule with GitHub Actions
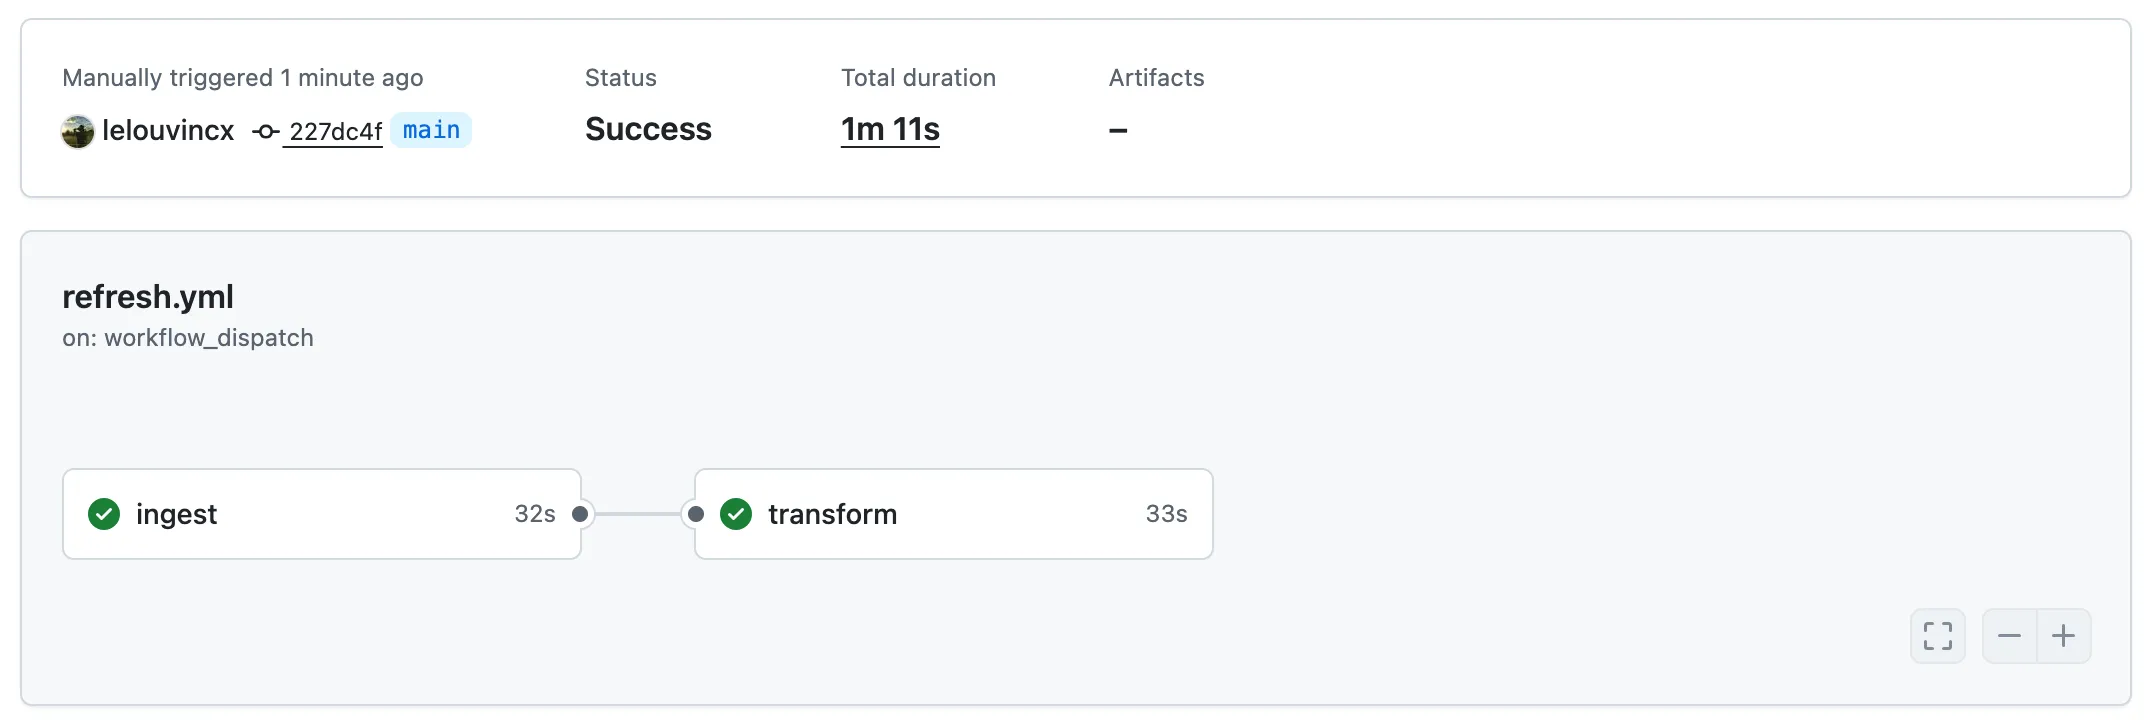
A workflow runs at 01:00 UTC every day, or on demand from the Actions tab. It has two jobs: ingest runs make ingest, then transform runs make transform once ingest succeeds. If dbt fails, you can rerun the transform job without loading the data again. Each job gets only the tokens it needs from repository secrets.
The whole run takes about a minute: 32 seconds for ingest and 33 seconds for transform.
5.4 Define metrics with anfra
This is the part the free stack never had.
dbt shapes the tables. It doesn’t say what “median response time” means, or whether bots count as contributors. Without that, every chart and every AI prompt decides for itself. anfra adds a semantic layer on top of the dbt marts: models, metrics and joins as code, reviewed in pull requests like the dbt project.
Set up the anfra project:
cd anfra
anfra init .   # adds .anfra/, models/, datasets/ and apps/; changes no existing file
Connect the warehouse. Locally it’s the DuckDB file:
# anfra/.anfra/data_sources.yml  (git-ignored when it holds credentials)
data_sources:
  github:
    type: duckdb
    connection:
      path: ../data/github.duckdb
Then point anfra at the dbt project, so the agent can read your dbt model and column descriptions:
# anfra/.anfra/context_sources.yml
sources:
  - name: dbt_github
    type: dbt
    local: { path: ../transform }
dbt compile --project-dir ../transform # anfra reads target/manifest.json
anfra ingestNow the metrics. Each one is written once, with a description:
// anfra/datasets/github_health.dataset.aml (excerpt)
Dataset github_health {
  label: 'GitHub health of data tools'
  data_source_name: 'github'
  models: [dim_repos, dim_authors, fct_issues, fct_pull_requests, fct_releases, fct_repo_snapshots]
  relationships: [
    relationship(fct_issues.repo_id > dim_repos.repo_id, true),
    relationship(fct_pull_requests.repo_id > dim_repos.repo_id, true),
    relationship(fct_releases.repo_id > dim_repos.repo_id, true),
    relationship(fct_repo_snapshots.repo_id > dim_repos.repo_id, true),
    relationship(fct_issues.author_id > dim_authors.author_id, true),
    relationship(fct_pull_requests.author_id > dim_authors.author_id, true),
    relationship(dim_authors.repo_id > dim_repos.repo_id, true)
  ]

  metric median_first_response_hours {
    label: 'Median First Response (hours)'
    type: 'number'
    description: 'Median hours from an issue being opened to the first comment by a maintainer. Only issues opened by people outside the core team count, and only those that got a reply.'
    definition: @aql fct_issues | where(dim_authors.author_type == 'community') | median(fct_issues.hours_to_first_response) ;;
  }
  metric community_pr_share {
    label: 'Community PR Share'
    type: 'number'
    description: 'Share of merged pull requests opened by people outside the core team. Bots are excluded from both sides.'
    definition: @aql (fct_pull_requests | where(dim_authors.author_type == 'community') | count_if(fct_pull_requests.is_merged)) * 1.0 / (fct_pull_requests | where(dim_authors.author_type != 'bot') | count_if(fct_pull_requests.is_merged)) ;;
    format: '#,##0.0%'
  }
  // …7 more: issue_count, response_rate, pr_count, merged_pr_count,
  // median_hours_to_merge, release_count, total_stars
}
Check it and query it:
anfra validate
anfra query -d github_health 'explore {
  dimensions { tool: dim_repos.tool }
  measures { median_response_h: median_first_response_hours, community_share: community_pr_share }
  sorts { median_response_h asc }
}'
+----------+-------------------------------+-----------------------+
| Tool | Median First Response (hours) | Community PR Share |
+----------+-------------------------------+-----------------------+
| Metabase | 15.641666666666666 | 0.0023978077186572275 |
| DuckDB | 35.225 | 0.3176158399673403 |
| Superset | 75.05000000000001 | 0.30045816252712804 |
| dlt | 104.81666666666666 | 0.21785714285714286 |
| dbt | 224.28333333333333 | 0.07586206896551724 |
| Cube | 276.125 | 0.02707692307692308 |
| SQLMesh | 1534.9166666666665 | 0.5714285714285714 |
| Evidence | 3174.8 | 0 |
| anfra | <none> | 0 |
+----------+-------------------------------+-----------------------+
Timings:
compiling_query 116 ms
executing_query 44 ms
total 242 msThe point: “median first response” now means one thing. The dashboard, the next dashboard and any AI agent that asks for it get the same number.
5.5 Build the dashboard
With the metrics defined, the dashboard is a prompt away. These three prompts rebuild it:
Build an anfra dashboard on github_health that answers: which open-source
data tools are the healthiest to adopt? Compare tools by response time,
community share and releases, and show the trend over time.
Check https://anfra.ai/interaction-patterns/agents.md and apply the
interactions that fit this dashboard.Make it follow GitHub's design system, with less text and some motion.
Add a menu to each table row, with View underlying data on right-click.The agent picks the layout, so your dashboard will look similar to mine, not identical.
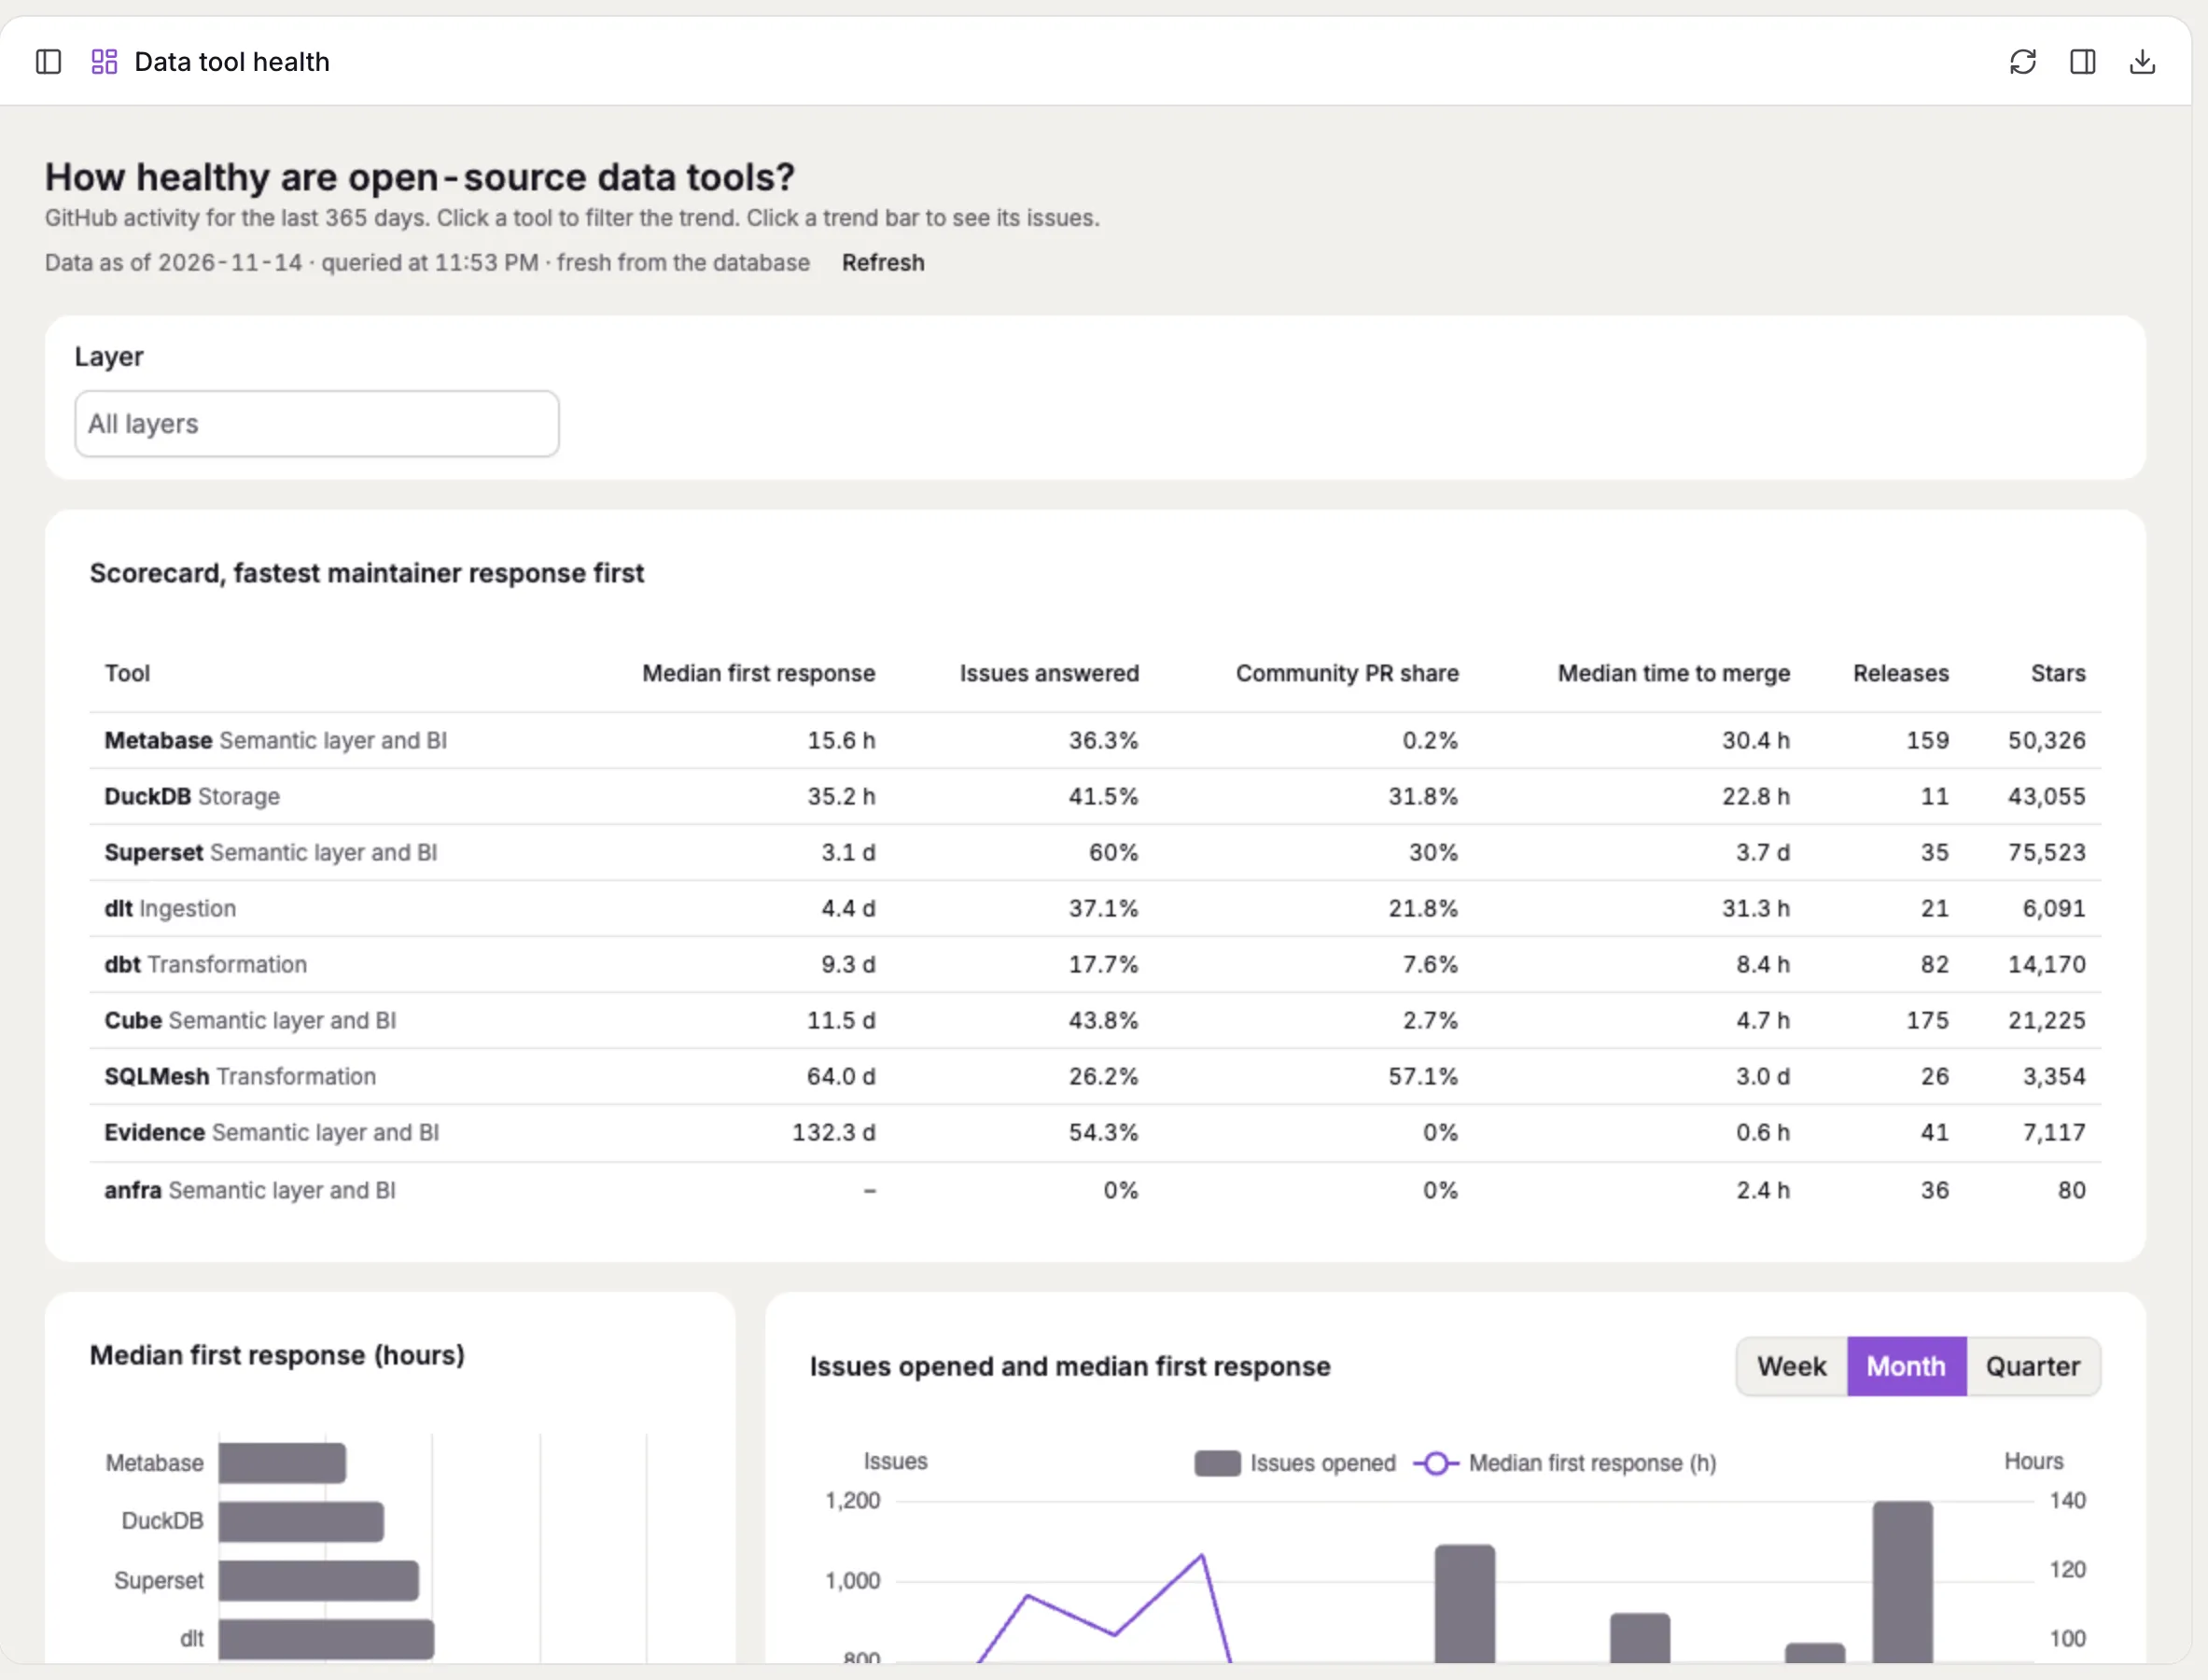
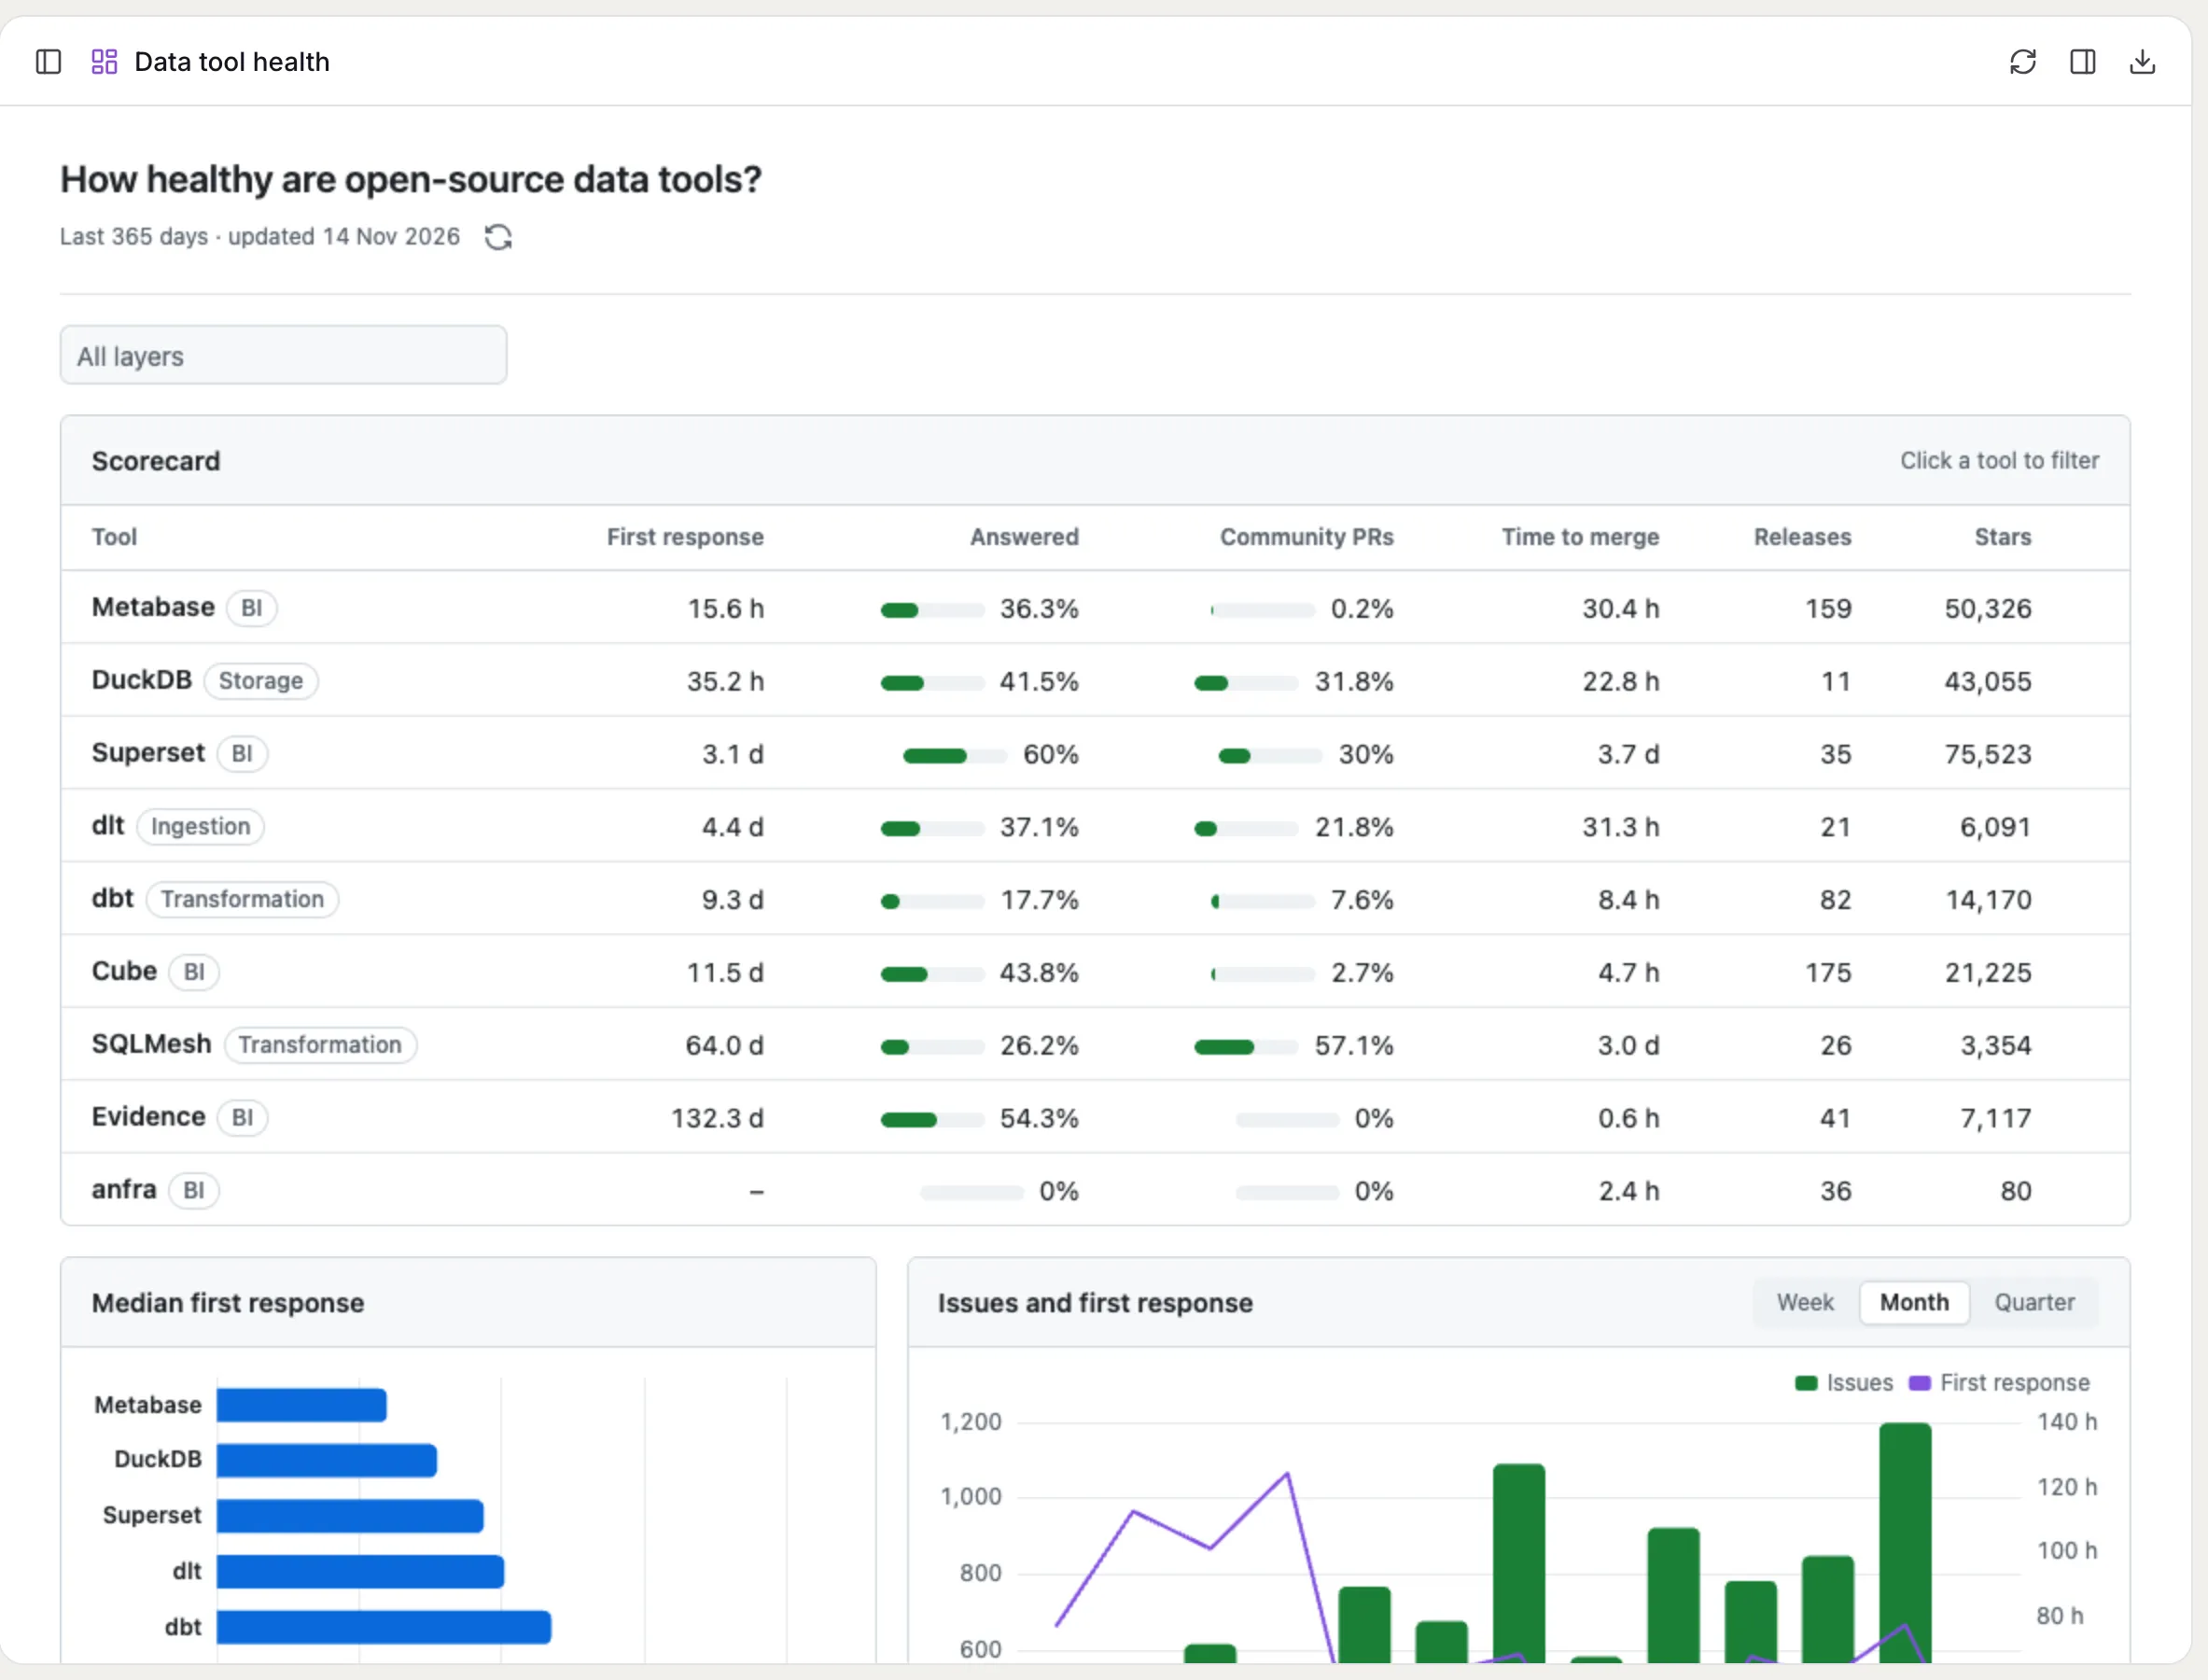
Each prompt took 10 to 11 minutes. The first gave a working scorecard, a response-time bar chart and an issues trend with a layer filter. The second added the interactions: sortable columns, a “data as of” line with Refresh, filter chips with Reset all, and View underlying data on the trend bars.
The third gave it GitHub’s look, with much less text, some motion and a menu on each row:
Run it locally:
anfra serveOpen http://127.0.0.1:7878/ and the app is there. It reloads whenever the agent edits the app or the AML.
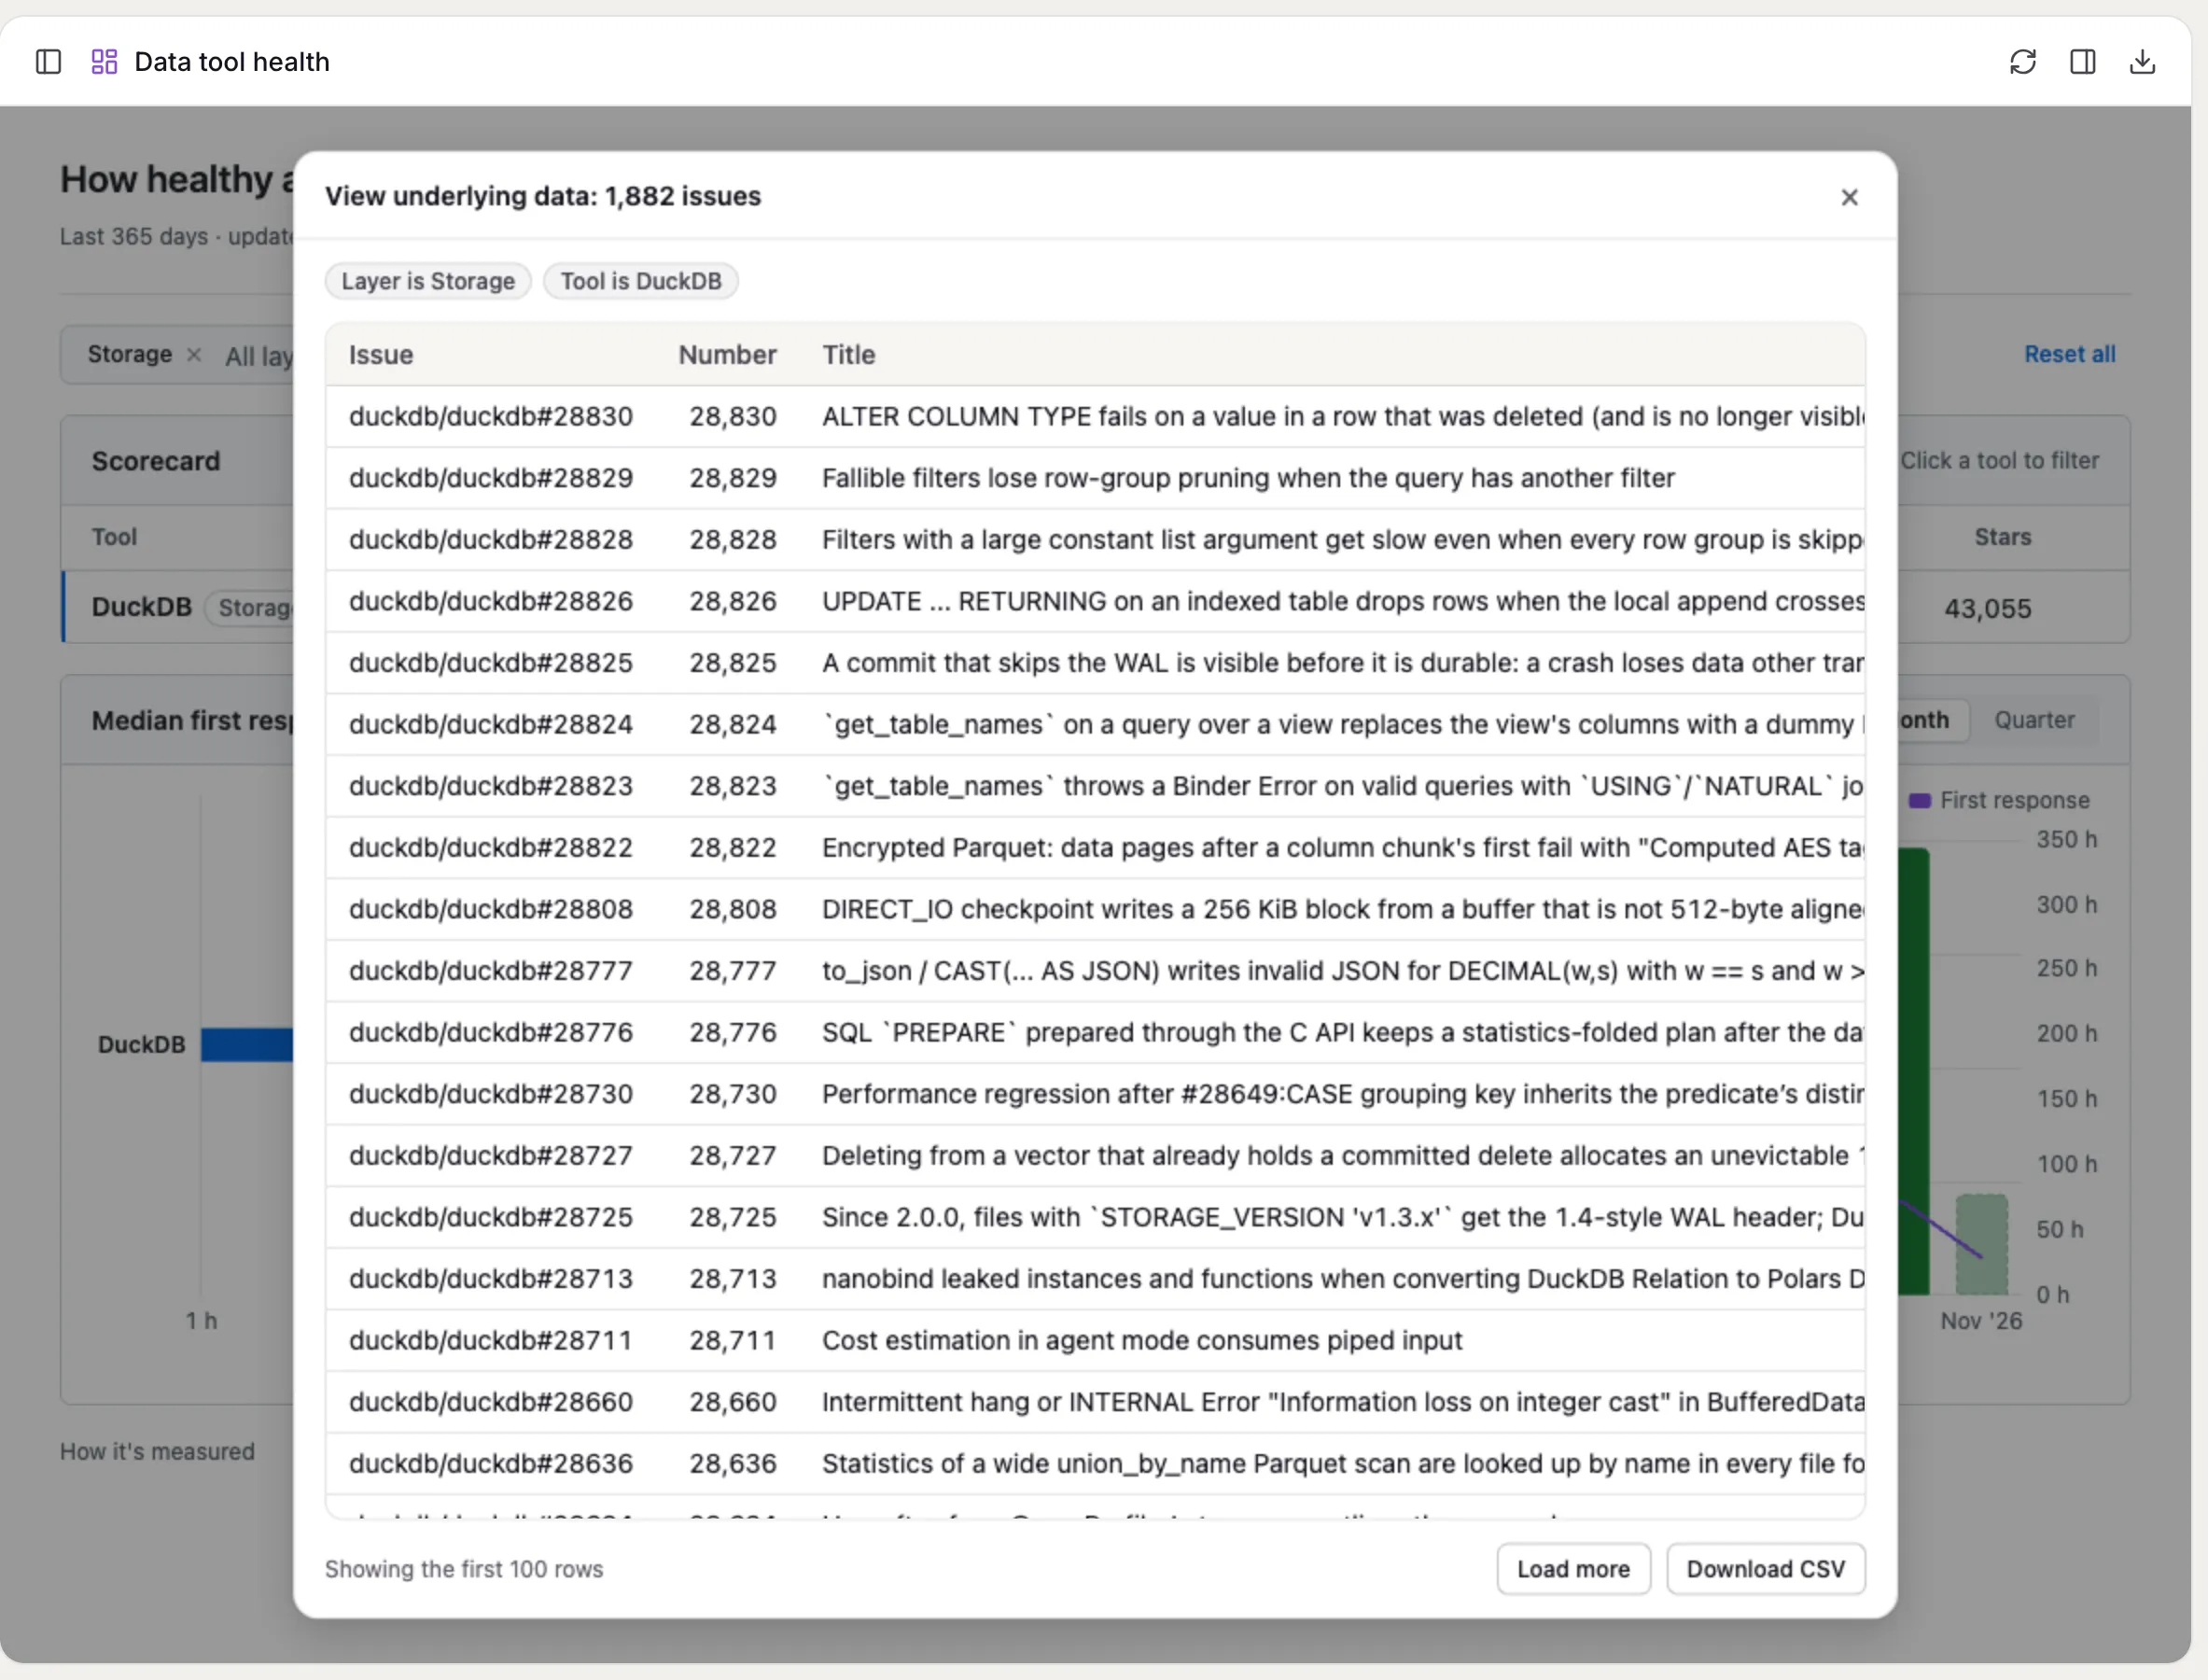
What came built in, with no code from me or the agent: the View underlying data window, with paging and CSV download; PNG and PDF export of the whole page; and the plumbing for filters, cross-filtering and the date drill. The app only says which field each control maps to, and anfra rewrites the queries.
5.6 Insights
Data as of 14 November 2026, issues and pull requests opened in the previous 365 days.
Metabase replies fastest, but not most often. Median time to a maintainer’s first reply on a community issue:
- Metabase: 15.6 hours
- DuckDB: 35 hours
- SQLMesh: about 64 days
- Evidence: about 132 days
Fast is not the same as thorough. Metabase replies to only 36% of community issues within their first 10 comments. Superset replies to 60%.
SQLMesh relies most on its community. Share of merged pull requests opened by people outside the core team:
- SQLMesh: 57%
- DuckDB: 32%
- Superset: 30%
- Metabase and Cube: under 3%
One number was wrong at first. The first version said the community opened 85% of Metabase’s merged pull requests. That was false:
- Metabase hides its org membership, so GitHub labels its own engineers as contributors.
- Its top “contributor” was
github-automation-metabase, a user account rather than a GitHub App, with 5,599 merged pull requests.
The fix added two rules to one dbt macro:
- anyone who has merged a pull request counts as core team
- automation accounts count as bots
Metabase’s community share fell from 85% to 0.2%, and dbt’s from 83% to 8%. Every metric that uses author type changed at once, because they all read the same macro.
The agent caught the error, not me. While checking its metrics against plain SQL, it found two numbers that could not both be true. In that version, Metabase replied to only 3% of community issues, yet the community opened 85% of its merged pull requests.
And anfra? It’s the newest project here, with 3 issues in the window. Only one came from the community, and no maintainer has replied to it yet, so anfra has no response time to show. It does ship often: 36 releases in the year.
5.7 Share on anfra Cloud
anfra serve is for your laptop. To share the dashboard, publish the project to anfra Cloud, which is free during the beta.
One catch: anfra Cloud can’t read a DuckDB file on your laptop. Point the data source at MotherDuck instead. dlt and dbt write to MotherDuck with TARGET=motherduck, and the free tier is plenty: the whole database is about 28 MB, against MotherDuck Lite’s 10 GB.
The org needs a data source with the same name, github, so the AML doesn’t change. Locally it’s DuckDB; in the cloud it’s MotherDuck:
# the org's data source: add it once, and never commit the token
data_sources:
  github:
    type: motherduck
    connection:
      token: <your MotherDuck token>
      dbname: github
anfra publish check
anfra publish --set-org https://us.anfra.ai/o/lelouvincx --create-data-sourcesMine is live at zero-dollar-data-stack.pages.holistics.dev.
6. Tear down
Nothing runs on your machine after anfra serve stops. To stop the daily refresh, disable the workflow in the GitHub Actions tab.
7. Considerations
Time to be honest about this stack:
- The agent isn’t free. Everything else is. I used a $20/month Claude subscription.
- The free limits are real limits. MotherDuck Lite caps storage at 10 GB and compute at 10 hours a month. GitHub Actions is only unlimited while the repo stays public. anfra Cloud is free during the beta, and pricing after it isn’t public yet. All of these terms can change. Check them before you build a company on this.
- DuckDB is single-writer. Fine for one daily job. If several pipelines write at once, use MotherDuck or a warehouse.
- anfra is young but promising. Two rough edges I hit:
anfra servekeeps the DuckDB file open, so stop it before runningmake ingestor dbt locally.- Publishing replaces everything in the org, and the cloud needs a data source with the same name as your local one.
Conclusion
To recap, we built:
- ingestion from the GitHub API with dlt
- a DuckDB warehouse, modelled with dbt
- a free daily schedule with GitHub Actions
- a semantic layer with anfra, where every metric is defined once
- a dashboard built by a coding agent, shared with a link
Every layer of the modern data stack now has a free, open-source default. BI was the last one missing. With a semantic layer as code and a coding agent on top, it’s not anymore.
If you want a tool added to the dashboard, submit a PR! If you try it, or something breaks, open an issue on the repo or reach me on LinkedIn or X.
FAQ
Is there a free modern data stack that includes BI? Yes. dlt, DuckDB, dbt Core and GitHub Actions cover ingestion to orchestration for free, and anfra adds an open-source semantic layer and BI. This post builds one end to end.
Can I use anfra with dbt? Yes. anfra reads your dbt project’s manifest as context, and its models sit on top of your dbt marts.
Can anfra connect to DuckDB? Yes, for local and self-hosted use. anfra Cloud doesn’t support DuckDB files, so use MotherDuck to share apps there.
Do I need to learn AQL? Not to start, because the coding agent writes it. You should be able to read it in review, the same way you read SQL an agent writes.
Is this production ready? For a side project or a small team, yes. For a larger team, not as is: you’d outgrow DuckDB and the GitHub Actions free limits first. The good part is that the whole stack is code, so you can swap in better tools for storage and orchestration and keep the rest, especially the metrics and business context you defined in AMQL (anfra’s AML and AQL).
Recommended reading
- Goodreads ELT pipelines, my earlier, heavier stack
- dbt tutorial by Start Data Engineering
- I let a coding agent build my dashboard. I didn’t let it touch the math. by Mark Pham
- anfra docs